Sunday, May 25, 2014

MA-ATR Indicator

This indicator combines Moving Average (MA) and Average True Range (ATR) to visualize potential trade signals. Black solid line indicates MA, Red solid line indicates MA+2*ATR, Red dash line indicates MA+1.5*ATR, Green solid line indicates MA-2*ATR, Green dash line indicates MA-1.5*ATR


Entry Rules:

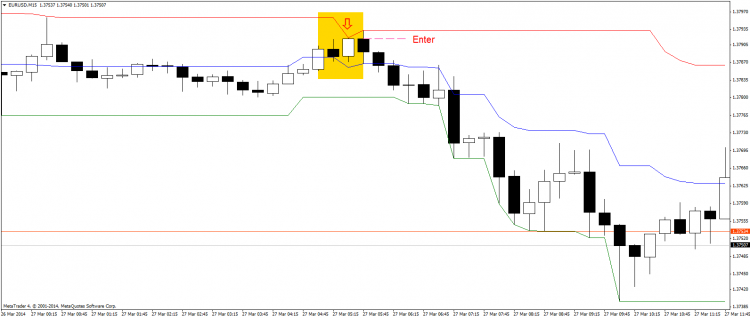
1. The price must cross over the moving average line and close on the opposite side
2. The trade’s direction will be determined based on the direction of the cross;
1. a long position when the price crosses from below and closes above the moving average
2. a short position when the price crosses from above the moving average and closes below
3. A trade can only be placed if it coincides with the current trend;
1. a long position must have a positive moving average slope
2. a short position must have a negative moving average slope
3. no trade should be placed if there is a flat moving average slope
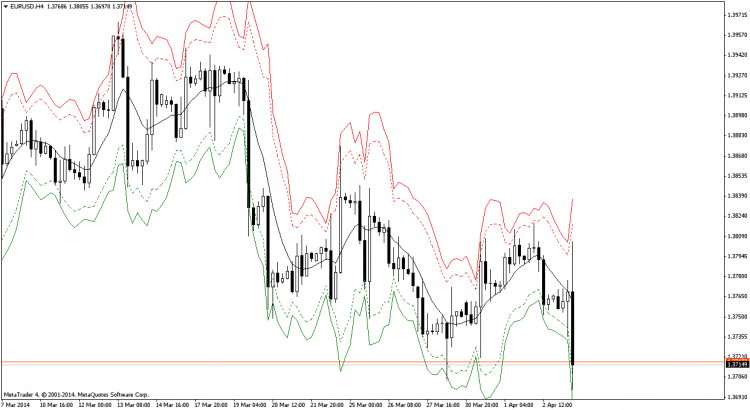
4. The highest high or the lowest low must not touch, pass or be very close to dash lines (reversal points).

Exit Rules:
1. The position will be closed if the price crosses the moving average to the side opposite of the entry position and reaches the 1.5 ATR level on that side.
2. The position will be closed if the price crosses the moving average to the side opposite of the entry position and closes on that side.
3. The position will be closed if the price reaches the 2.0 ATR level.
4. The position will be closed if the price crosses the 1.5 ATR level on the entry side and closes;
1. below the 1.5 ATR line for long position
2. above the 1.5 ATR line for short position

Donchian Channel Indicator

Donchian Channel indicator is originally designed by Richard Donchian. The indicator can capture the price movement and the price trend decently. There is only one parameter to set manually, the number of previous trading sessions, or bars, which has a default value of 20. The highest high, the lowest low and their mean value is calculated which indicates the current support and resistance levels. One can use this indicator to develop his/her own scalping strategy. In the following figure, there is an example how to spot a SELL signal for scalping purposes:


Friday, March 28, 2014

H3, H6, H8 and H12 Candle Sticks Indicator

This indicator is for those who would like to have H3, H6, H8 and H12 candle sticks on their charts. An input variable is considered to compensate the time difference between your brokers' server clock and GMT0. You can change the color of bearish, bullish and Doji candles as well.

Here is a short description of each input variable task/purpose:
  1. TimeFrameInMinutes [Integer Variable]: Your desired time frame in minutes. For example, if you want to have H8 time frame, you set this variable to 480.
  2. UpCandleColor [Color Variable]: Bullish candles color.
  3. DownCandleColor [Color Variable]: Bearish candles color.
  4. DojiCandleColor [Color Variable]: Doji's candles color.
  5. BrokerHourDiffGMT [Integer Variable]: Your broker's time difference in GMT. For example, if your broker's server time starts a day at GMT +2, you set this variable to 2.
  6. NumCandlesToRedraw [Integer Variable]: The number of candle sticks you would like to be drawn.
  7. Width [Integer Value]: Tickness of candles.